
Ahhh…the pitter patter of rain gently falling on your roof — soothing you to sleep — but alas, for some folks this sound can be a cause for insomnia. When rain hits our roofs and pavement it picks up all sorts of pollution along the way and delivers it directly into our waterways. This water does not go to a treatment plant. Dirt, bacteria, metals, pesticides, weed killer, soap, petroleum and more end up in the Salish Sea via storm drains and creeks. Stormwater is the number one source of pollution in the Salish Sea and is killing salmon directly and impacting countless other organisms in a myriad of ways, including those who depend on it for sustenance. But how bad is this pollution in Bellingham and what does that mean for Bellingham Bay?
Filling a data gap in Bellingham’s stormwater
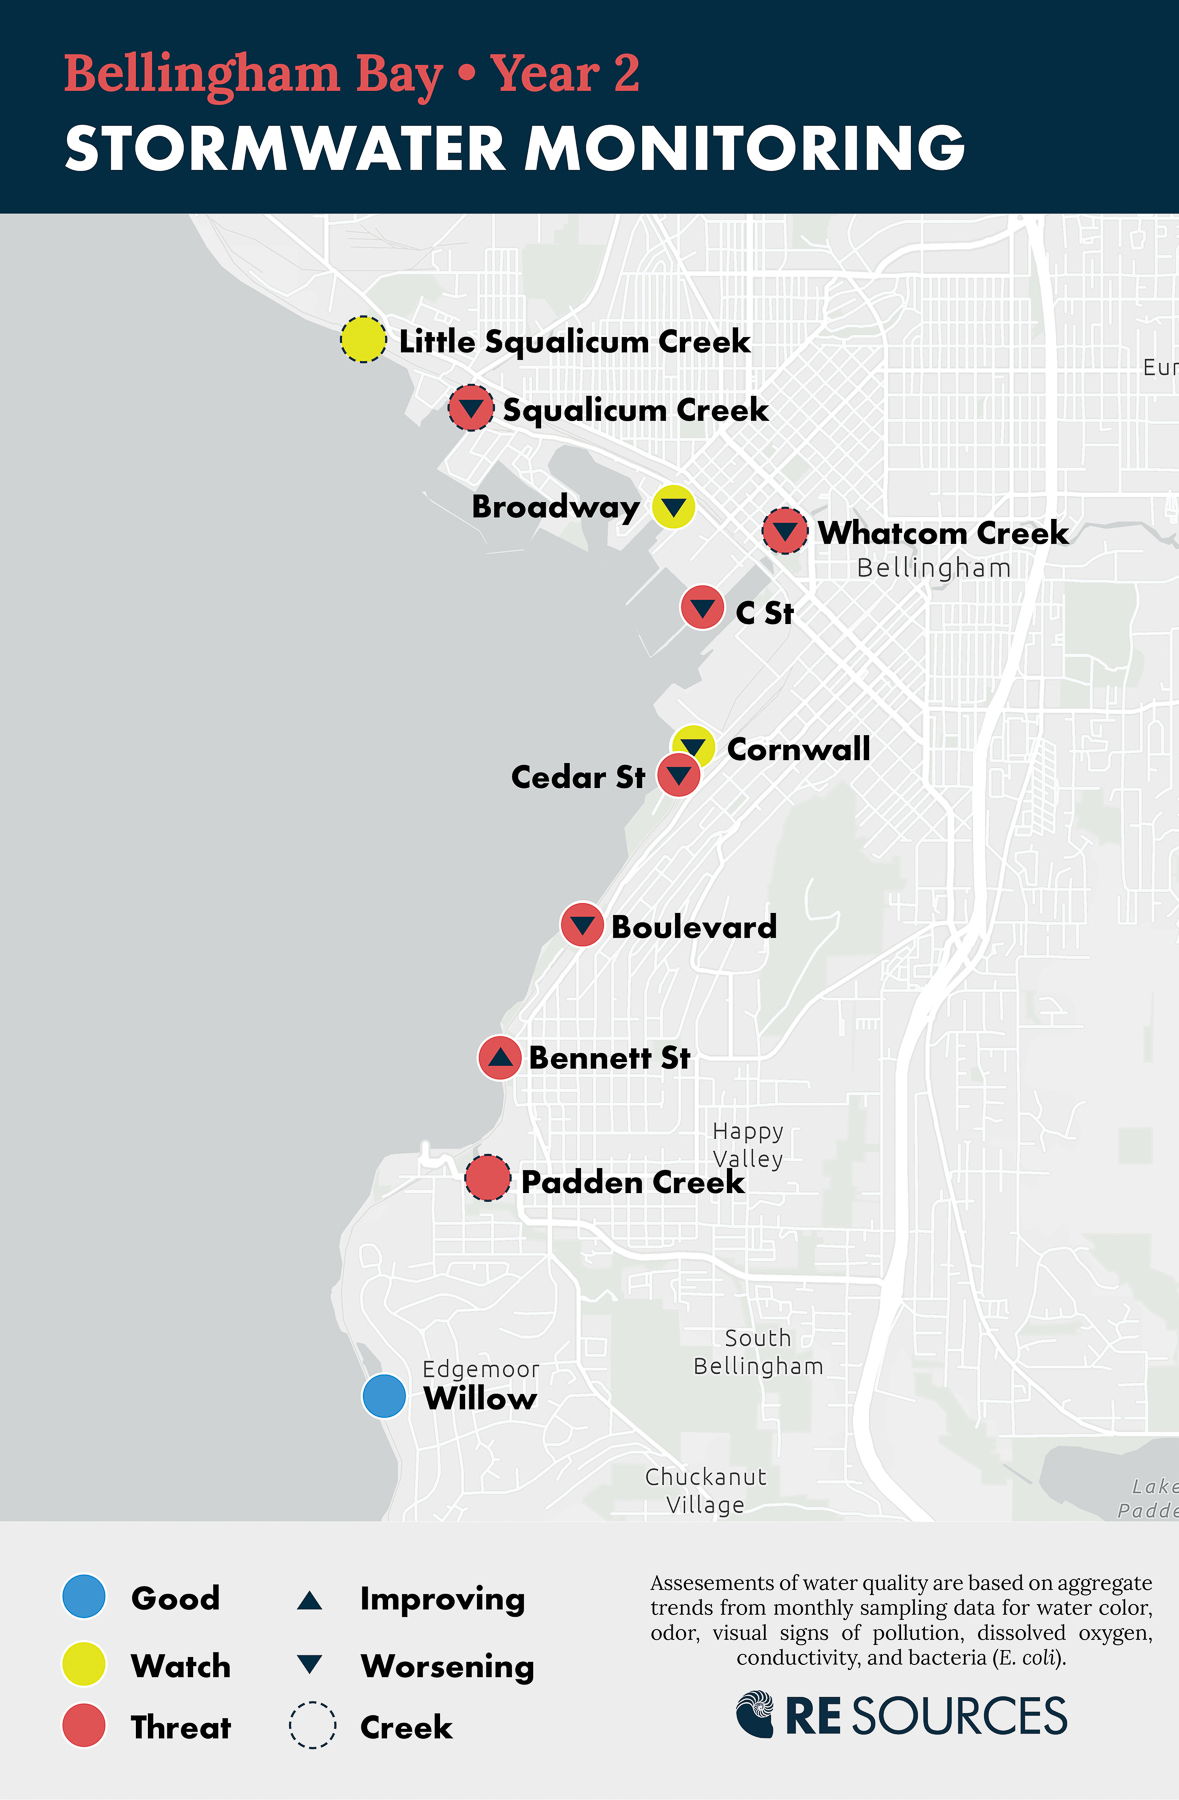
We set out to answer this question in 2020 by scouring for data on stormwater quality in Bellingham and quickly discovered that there was very little information on water quality at outfalls (the places storm drains flow to, releasing all that water and pollution). Regularly monitoring outfalls is not required, so it often isn’t done. During the fall of 2020 we developed a study that would monitor six large outfalls and two urban creeks (Squalicum and Whatcom) every month to better understand the quality of the water that is being dumped into the bay, and to fix pollution sources when we found them. See the map below for the monitoring locations. These outfalls and creeks drain the majority of the built-out areas in Bellingham and provide a great overview of the general stormwater health of the city. Note: In 2022, for year 2 of the program, we added Little Squalicum Creek, Padden Creek and Willow outfall as stormwater monitoring sites.
Basic water quality parameters were measured including dissolved oxygen, water temperature, conductivity, pH, ammonia, turbidity, and Escherichia coli (E. coli) bacteria. The water was also monitored for visuals (sheens, bubbles, etc.), odor, color, and flow.
Murky waters, clear challenges: Year 2 Findings
In 2022, E. coli bacteria was the most common water quality issue followed by (in order): color, visual, conductivity, odor, dissolved oxygen, and creek temperature. The total number of exceedances for 2022 was 155, which is 65 more than in 2021. Approximately half of the exceedances are observational (color, odor, and visual) which can be subjective and caused by natural and benign sources. However, often these reports note fossil fuel sheens and other illicit discharges. Nearly one-third of the 2022 exceedances were for E. coli which reiterates that the City of Bellingham has a bacteria problem.
In 2021, Year 1 of the monitoring program, every one of the testing sites exceeded state water quality standards at least five times over the year and one had over 27 exceedances — that’s over two exceedances per month! But they varied on what parameters were of concern.
How to use our stormwater monitoring map (updated with year 2 data!)
Click on the image below to open our interactive stormwater monitoring map in a new tab. This map is a feature of the Waterkeeper Alliance’s Water Reporter app, and shows two sets of data in our region:
- Water Reporter Posts, which maps instances where users of the Water Reporter app reported instances of suspected pollution in the Bellingham area.
- Monitoring Program, which maps the eight locations where our scientists monitored stormwater outfalls and streams flowing into Bellingham Bay.
To focus on the monitoring program data, toggle off the Water Reporter posts in the map detail menu on the left side of the map. Next, navigate to specific location markers on the map to see how each outfall or stream scored across several pollution criteria. Use arrows on either end of the the bar at the bottom of the map to browse the different indicators.
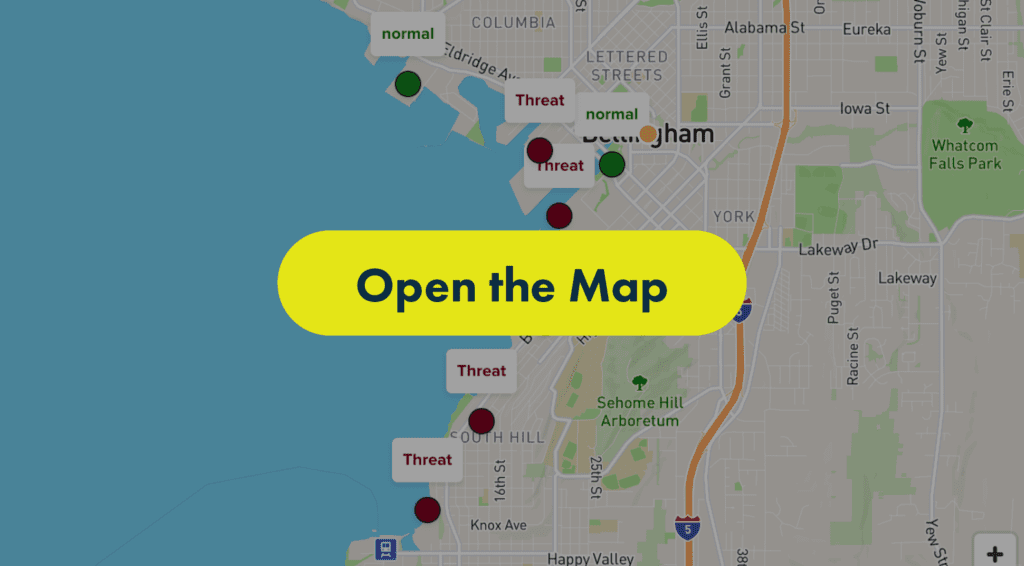
After looking critically at the data we assigned each monitoring site an overall rating of Threat, Watch, or Good. Threat signifies that the site has severe exceedances that occur regularly (not just once or twice). Watch signifies that the site has some exceedances but they are either very infrequent or unable to link to a pollution source. Good denotes a site that rarely has an exceedance and when it does occur it is not egregious. The image below details overall ratings for 2022.
What comes next
Despite continued reporting of exceedances to regulatory agencies, to our knowledge, there has not been any significant work to address the chronic pollution occurring at the outfalls. The urban streams monitored in this program are all impaired bodies of water and are under different management strategies to improve their water quality (namely Total Maximum Daily Load, TMDL, programs). The outfalls, however, do not have any known management strategies to improve their discharges. This data shows chronic violations of stormwater permits that are directed by the Clean Water Act and pose substantial threats to human health and the environment for those who recreate or fish in Bellingham Bay, particularly vulnerable populations.
During our first year of monitoring, we reported exceedances to the City of Bellingham, the Port of Bellingham, and the Department of Ecology. The agencies were receptive to the information we provided and they helped identify and remove some of acute pollution sources. For example, a petroleum sheen noted at the C Street outfall was found to be from a leaky car up the road, the owners were approached and the car was removed. High E. coli counts also at the C Street outfall were attributed to a couple of RVs that were dumping their toilettes directly into the storm drains. City and Port employees joined RE Sources at the C Street outfall in February 2022 to look at and discuss the pollution problems witnessed here, most notably a white bacterial mat — yuck! Bacteria growth can be an indication of a pollution source. In this case it may be related to the sulfur smell (think rotten eggs) and the E. coli.
Unfortunately, the second year of reporting has revealed that many of the problems have not been fixed and are presenting themselves as chronic conditions rather than one-offs. The bacteria mat and fossil fuels sheen at C street, for example, seem to be chronic pollution problems and are not being further addressed.
Our data shows that Bellingham has a bacteria problem. It’s worrisome that high bacteria counts found at Boulevard and Bennett are not being addressed, particularly because these areas are popular for recreation — including swimming. Even very small amounts of E. coli can cause illness. The high conductivity we found, which is an indicator of potentially polluting dissolved substances, at the Cedar outfall are a mystery as well. This drainage system travels under a Model Toxics Control Act (MTCA) Cleanup site called RG Haley where wood was treated with petroleum products.
The Cornwall Landfill MTCA site sits next door. It is unknown whether either of these cleanup sites are contributing to these exceedances. Both of these sites are expected to be cleaned up within a few years; it will be interesting to see if the water quality changes after the cleanup work.
E. coli bacteria is likely coming from human waste and pet waste. We recommend that sewage systems be investigated. Old systems may be leaking into the stormwater and that this can be assessed with smoke and dye testing.
In the near-term, we recommend the City install more port-o-potties and dumpsters for those experiencing homelessness. More comprehensively, creating more affordable housing and investing more in support services for those experiencing homelessness can also have positive benefits to our environment.
There are an estimated 20,000 dogs in Bellingham and everyone that owns a pet needs to clean up after them. We recommend that the City install more dog waste stations and more trash cans especially in public areas near waterways.
The Big Picture: Too many chemicals, too much bacteria
The sources of pollution impacting the health of Bellingham Bay and the water that feed into it are varied and multi-faceted, but the big picture is clear. As a community, we need greater attention and development to addressing water pollution. We urgently need stronger regulations and greater investments in stormwater filtration. We also need to push for extended producer responsibility policies that hold corporations accountable for the end-of-life impacts of their products, including the chemicals and materials that end up polluting our waters.
You can help protect our waters
If you don’t run into RE Sources on the beach, but see some fishy pollution (pun definitely intended), you can easily report it with a call or text the Pollution Prevention Hotline: (360) 220-0556
You can also take a critical look around you and your home. Are you contributing in any way to our pollution problem? What do you put on your lawn? How do you wash your car? Do you clean up after your pets? How can you reduce your everyday impact and inspire others to do the same?
Want to dig deeper into the data and findings?
Read our full reports:
2023 Summary Report: Year 3
2022 Summary Report: Year 2
2021 Summary Report: Year 1